Bihar Board Class 9th Maths Solutions Chapter 14 Statistics Ex 14.2 Textbook Questions and Answers.
BSEB Bihar Board Class 9th Maths Solutions Chapter 14 Statistics Ex 14.2
![]()
Question 1.
Hie blood groups of 30 students of Class VIII are recorded as follows:
A, B, O, O, AB, O, A, O, B, A, O, B, A, O, O, A, AB, O, A, A, O, O, AB, B, A, O, B, A, B, O.
Represent this data in the form of a frequency distribution table. Which is the most common and which is the rarest blood group among these students?
Solution:
The frequency distribution table is as under:
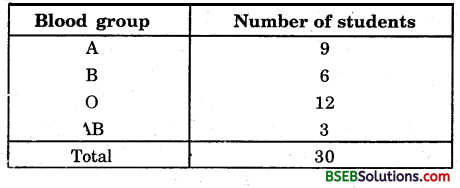
Clearly, Most common – O, Rarest – AB.
Question 2.
The distance (in km) of 40 engineers from their residence to their place of work were found as follows:
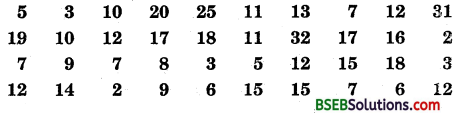
Construct a grouped frequency distribution table with class size 5 for the data given above, taking the first interval as 0-5 (5 not included). What main features do you observe from this tabular representation?
Solution:
The minimum and maximum km in the given raw data are 2 and 32 respectively. It is given that 0 – 5 is one of the class intervals and the class size is same. So, the classes of equal size are
0 – 5, 5 – 10, 10 – 15,15 – 20, 20 – 25, 25 – 30 and 30 – 35.
Thus, the frequency distribution table is as given under:
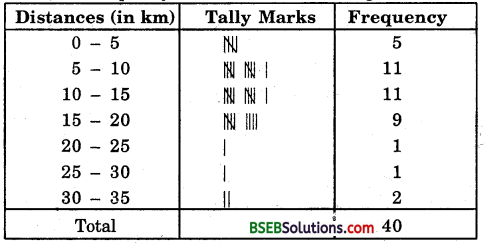
In this the upper limit of a class is not included in the class. Thus, in the class 0 – 5 of km. distance travelled by the engineer to their place of work, an engineer who is to travel 5 km is not included in this class. He is counted in the next class 5 – 10. It is known an exclusive method. It is observed that 27 engineers out of 40 lives at a distance not more than 15 km from their residence.
![]()
Question 3.
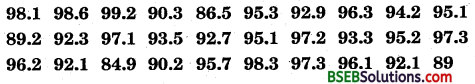
The relative humidity (in %) of a certain city for a month of 30 days was as follows:
(i) Construct a grouped frequency distribution table with classes 84 – 86, 86 – 88, etc.
(ii) Which month or season do you think this data is about?
(iii) What is the range of this data?
Solution:
(i) The minimum and maximum relative humidity (in .%) in the given raw data are 84.9 and 99.2 respectively. It is given that 84 – 86 is one of the class intervals and the class size is same. So, the classes of equal size are
84 – 86, 86 – 88, 88 – 90 ……, 98 – 100
Thus the frequency distribution table is as under
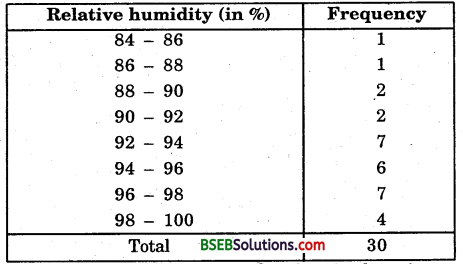
(ii) The data appears to Be taken in the rainy season as the relative humidity is high.
(iii) Range = 99.2 – 84.9 = 14.3
Question 4.
The heights of 50 students, measured to the nearest centimetre, have been found to be as follows:
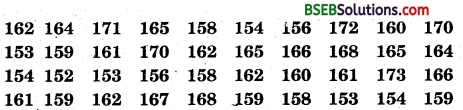 (i) Represent the data given above by a grouped frequency distribution table, taking the class intervals as 160 – 165, 165 – 170, etc.
(ii) What can you conclude about their heights from the table?
Solution:
(i) The minimum and maximum heights in the given raw data are 150 cm and 173 cm respectively. It is given that 160 – 165 is one of the class intervals and the class size is same. So, the classes of equal size are 150 – 155, 155 – 160, …, 170 – 175.
Thus, the frequency distribution table is as under:
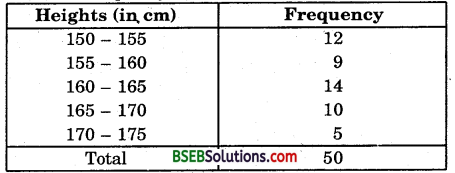
(ii) One conclusion that we can draw from the above table is that more than 50% of students are shorter than 165 cm.
![]()
Question 5.
A study was conducted to find out the concentration of sulphur dioxide in the air in parts per million (ppm) of a certain city. The data obtained for 30 days is as follows:
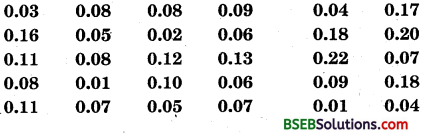
(i) Make a grouped frequency distribution table for this data with class intervals as 0.00 – 0.04, 0.04 – 0.08, and so on.
(ii) For how many days, was the concentration of sulphur dioxide more than 0.11 parts per million ?
Solution:
(i) The minimum and maximum of concentration of sulphur dioxide in the air in parts per million is 0.01 and 0.22 respectively. It is given that 0.00 – 0.04 is one of the class intervals and the class size is the same. So, the classes of equal size are
0.00 – 0.04, 0.04 – 0.08, …, 0.20 – 0.24.
Thus, the frequency distribution table is as under:
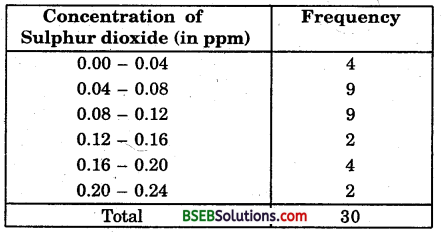
(ii) The concentration of sulphur dioxide was more than 0.11 ppm for 8 days.
![]()
Question 6.
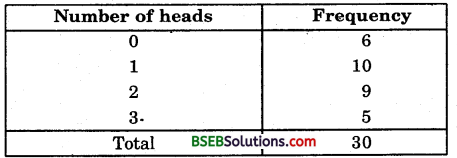
Three coins were tossed 30 times. Each time the number of heads occurring was noted down as follows:
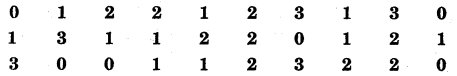
Prepare a frequency distribution table for the data given above.
Solution:
The frequency distribution table is on the next page:
Question 7.
The value of it upto 50 decimal places is given below:
3.14159265358979323846264338327950288419716939937510.
(i) Make a frequency distribution of the digits from 0 to 9 after the decimal point.
(ii) What are the most and the least frequently occurring digits ?
Solution:
(i) The frequency distribution table is as under:
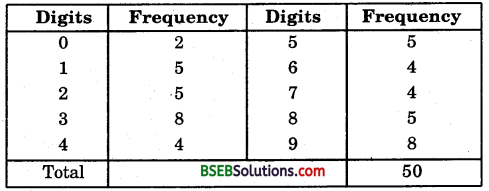
(ii) The most frequently occurring digits are 3 and 9. The least occurring is 0.
![]()
Question 8.
Thirty children were asked about the number of hours they watched TV programmes in the previous week. The results were found as follows :
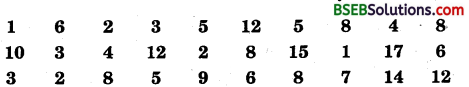
(i) Make a grouped frequency distribution table for this data, taking class width 5 and one of the class intervals as 5 – 10.
(ii) How many children watched television for 15 or more hours a week?
Solution:
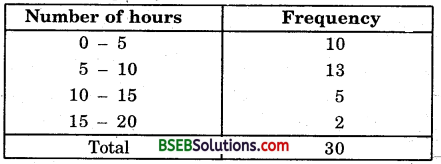
(i) The minimum and maximum number of hours children watched TV programmes in the previous week are 1 hour and 17 hours respectively. It is given that 5-10 is one of the class intervals and the class size is same. So, the classes of equal size are 0 – 5, 5 – 10, 10 – 15 and 15 – 20.
Thus, the frequency distribution table is as under:
![]()
(ii) 2 children watched television for 15 or more hours a week.
Question 9.
A company manufactures car batteries of a particular type. The lives (in years) of 40 such batteries were recorded as follows:
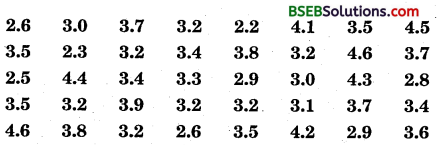
Construct a grouped frequency distribution table for this data, using class intervals of size 0.5 starting from the interval 2 – 2.5.
Solution:
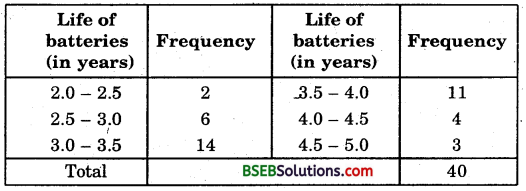
The minimum and maximum life in number of years of car batteries are 2.2 years and 4.6 years. It is given that 2 – 2.5 is one of the class interval with uniform size of 0.5. So, the classes of equal size are 2.0 – 2.5, 2.5 – 3.0, 3.0 – 3.5, …, 4.5 – 5.0.
Thus, the frequency distribution table is as under:
![]()